

Choosing the overall allocation of your investment portfolio – the plan for how much should be invested in stocks, cash, bonds and other investments – is the most important investment decision you will make. While over the long-term markets are driven by fundamental factors (such as the economy, company profits and cash flows), over the short term they are also driven by investor psychology including fear and greed. Studies show that most individual investors underperform the mutual funds and ETFs that they invest in due to the timing of their investment decisions. When markets are overly exuberant and priced highly many investors rush to put more money to work. On the other hand, after prices fall, they often rush to sell when prices are low. This is the opposite of the old business adage “buy low and sell high.” Selecting an asset allocation that allows you to sleep at night and not be prone to behavioral (versus fundamental) changes in markets can avoid the pitfalls that other investors face.
An appropriate asset allocation is one that matches your risk tolerance and need for investment returns. Risk tolerance is a function of your willingness and ability to take risk. In the simplest of terms willingness is how much of a loss of value or decline in income you are able to tolerate before calling your brokerage firm or advisor and saying “sell everything I cannot take it anymore” or just reach that state of discomfort that you cannot tolerate. Ability to take risk is a function of your overall investment assets and desired lifestyle. Do you have more than enough investments to fund your lifelong goals such as retirement spending no matter what happens? For most investors the answer is no and their willingness to take risk will outweigh their ability to take risk.
Financial planners will use a questionnaire and interview you to assess your risk tolerance. A key question is to present you with scenarios and ask you what would you do in certain situations. One of the most common is to present what types of market disruptions have occurred in the past or might occur.
We have two great examples in the last 15 years to look at. In the 2008 financial crisis the overall stock market peaked October 9, 2007 and reached a low point on March 9, 2009 (measured using the S&P 500 Large Cap Stock index). Your total return (loss) during that 17 month period if you were invested 100% in the S&P 500 would have been (52)%. Something that would not be tolerable for most investors. Using the same dates the total bond market had a total return of 7.5%. So having some bonds in your portfolio would have stemmed the losses.
More recently another major disruption occurred in 2022 when stocks declined by 24.5% from January 3, 2022 until October 12, 2022. Unfortunately, bonds would not have bailed us out as they declined 14.5% in that same period. The table below shows your overall return during these two disruptions depending upon how much of your investments were in stocks versus bonds.

What allocation(s) would have made you the most comfortable or uncomfortable. At what point might you make a drastic decision to exit the markets altogether? At what point would you be unhappy but still willing to stick with your investment plan? At what point would you feel unable to generate the income you need to meet your goals?
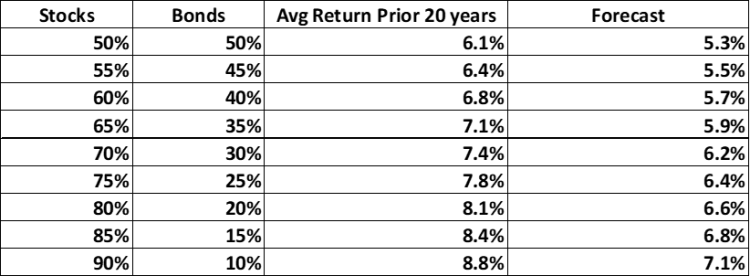
Your asset allocation not only determines the amount of risk you are taking but also determines your expected returns. Over the past 20 years an investment in an S&P 500 index fund would have generated an average annual return of 9.5% while an investment in a total bond market index fund would have generated an average annual return of 2.8%. These are historical returns that may not persist in the future. In fact, future returns are likely to be lower. This is due to the fact the overall stock market is priced relatively high compared to history (relative to company earnings and other metrics). This implies a lower expected annual return over the next 10 to 20 years. Let’s assume a future annual expected stock return of 7.5% (with a lot of variability as in the past) and a future expected total bond market return of 3% (with less variability than stocks). The table below shows what your historical and expected returns would be given different asset allocations:
Which allocation gives you the income you need to reach your goals? How does this match up with your willingness to take risk?
Your financial planner can help you assess your goals and risk tolerance. For example, a frequently used method is to estimate your desired level of spending during retirement and run a Monte Carlo simulation as to what might happen in the future. This involves using estimates of future returns, variability of returns, inflation and variability of inflation over some time period and running thousands of simulations to determine what your probability of success (not running out of money) would be given different levels of spending. So, let’s say that you have $1,000,000 of investments and want to be able to spend $30,000 to $40,000 during retirement each year with the amount of spending increasing for inflation each year. Using the return estimates above, this table shows the probability of success for spending rates of 4% ($40,000 per year in this example) and 3% ($30,000 per year in this example).

So, the probability of success for a 70% stock allocation would be about 75% for a $40,000 inflation adjusted spending goal. This equates to a 25% probability of failure (running out of money before 30 years). For a $30,000 inflation adjusted spending plan your probability of success is much higher at about 94%. What level of spending and asset allocation would make you the most comfortable?
Parting Thoughts
The examples above show the importance of making an asset allocation decision that is right for you. This decision will determine your expected returns, the overall risk you are taking and your probability of meeting your financial goals. No one knows with certainty what will happen in the future. History may not repeat but it does tend to rhyme. Looking at what has happened in the past is helpful in assessing what might happen in the future. The examples above use only two different types of investments. Your overall return versus risk can be enhanced by considering other types (small stocks, international stocks, preferred stocks, cash/money markets, real estate for example). Your financial planner can help you run simulations and help you develop an asset allocation and plan based on your circumstances and broader investment types.